Published in News
Market Pulse: The Great Subsidy Audit – The 'Net-Net' Position of EU Farmers
Deep dive into the EU farmer's balance sheet: Analysis of CAP payments vs. production taxes, the "French Anomaly," and why the net value of subsidies is shrinking due to green inflation.

Bo Pedersen
Chief Revenue Officer
Executive Summary: The "Net-Net" Verdict
Are EU farmers truly subsidised, or do regulatory costs consume the funding? A new "balance sheet" audit of the sector reveals that while European farmers remain overwhelming net beneficiaries of public funds, the "profit margin" of this support is shrinking and varies wildly by geography.
The Headline Number: The average EU farmer receives approximately €0.20 of policy support for every €1.00 of gross farm receipts. However, the nature of this support is shifting from a "benefit" to a "payment for services," altering the economic reality of the sector.
Column 1: The Credits (What Farmers Receive)
The flow of public wealth into the agricultural sector occurs in three distinct tiers, ranging from direct cash to "invisible" market protections.
1. The Cash (CAP Payments)
Pillar 1 (Direct Payments): Approximately €38 billion/year. These area-based payments function as a near 100% profit subsidy, requiring only that land is kept in "good condition."
Pillar 2 (Rural Development): €13 billion/year in grants for modernisation and environmental schemes.
Dependence: For the average EU farmer, these payments represent 30% to 50% of actual income. Without this liquidity, sectors like cereals and grazing livestock would become immediately loss-making.
2. The "Invisible Cheque" (Market Protections)
Value: OECD estimates suggest tariffs and quotas add another €10–€20 billion in value annually by keeping EU internal prices above world market rates.
Payer: This is a transfer of wealth from the European consumer (via higher supermarket prices) to the farmer, rather than a taxpayer-funded line item.
3. The Hidden Subsidies
Social Security: In countries like Poland (KRUS system) and France (MSA), the state heavily subsidises farmer pensions and healthcare.
Fuel Tax: The "Red Diesel" tax exemption saves the sector billions in operating costs compared to commercial logistics.
Column 2: The Debits (What Governments Extract)
While the inflows are massive, the "net" position is determined by what national governments claw back. This creates a fractured competitive landscape.
1. The Geographic Split: The "French Anomaly"
The Winners (East & South): In Germany, Poland, Romania, and Spain, agricultural production taxes are negligible relative to subsidies. For every €1 received, farmers might pay back just €0.02 to €0.10 in specific taxes.
The Squeeze (France): France acts as an outlier, levying heavy "production taxes." Analysis by the Institut Économique Molinari suggests that for every €1 a French farmer receives, the state claws back roughly €0.18 to €0.35. This explains the disparity in sentiment between French farmers (who feel like net contributors) and their Polish neighbours.
2. The "Time Tax" & Green Inflation
Admin Burden: Compliance costs are estimated at €200–€500 per farmer/year in direct cash, but the "opportunity cost" of time spent in the office is significantly higher.
Cost to Unlock: New "Eco-schemes" (25% of the direct payment budget) require farmers to incur up-front costs (e.g., planting cover crops). This reduces the "net" value of the subsidy because the farmer must now spend money to get the money.
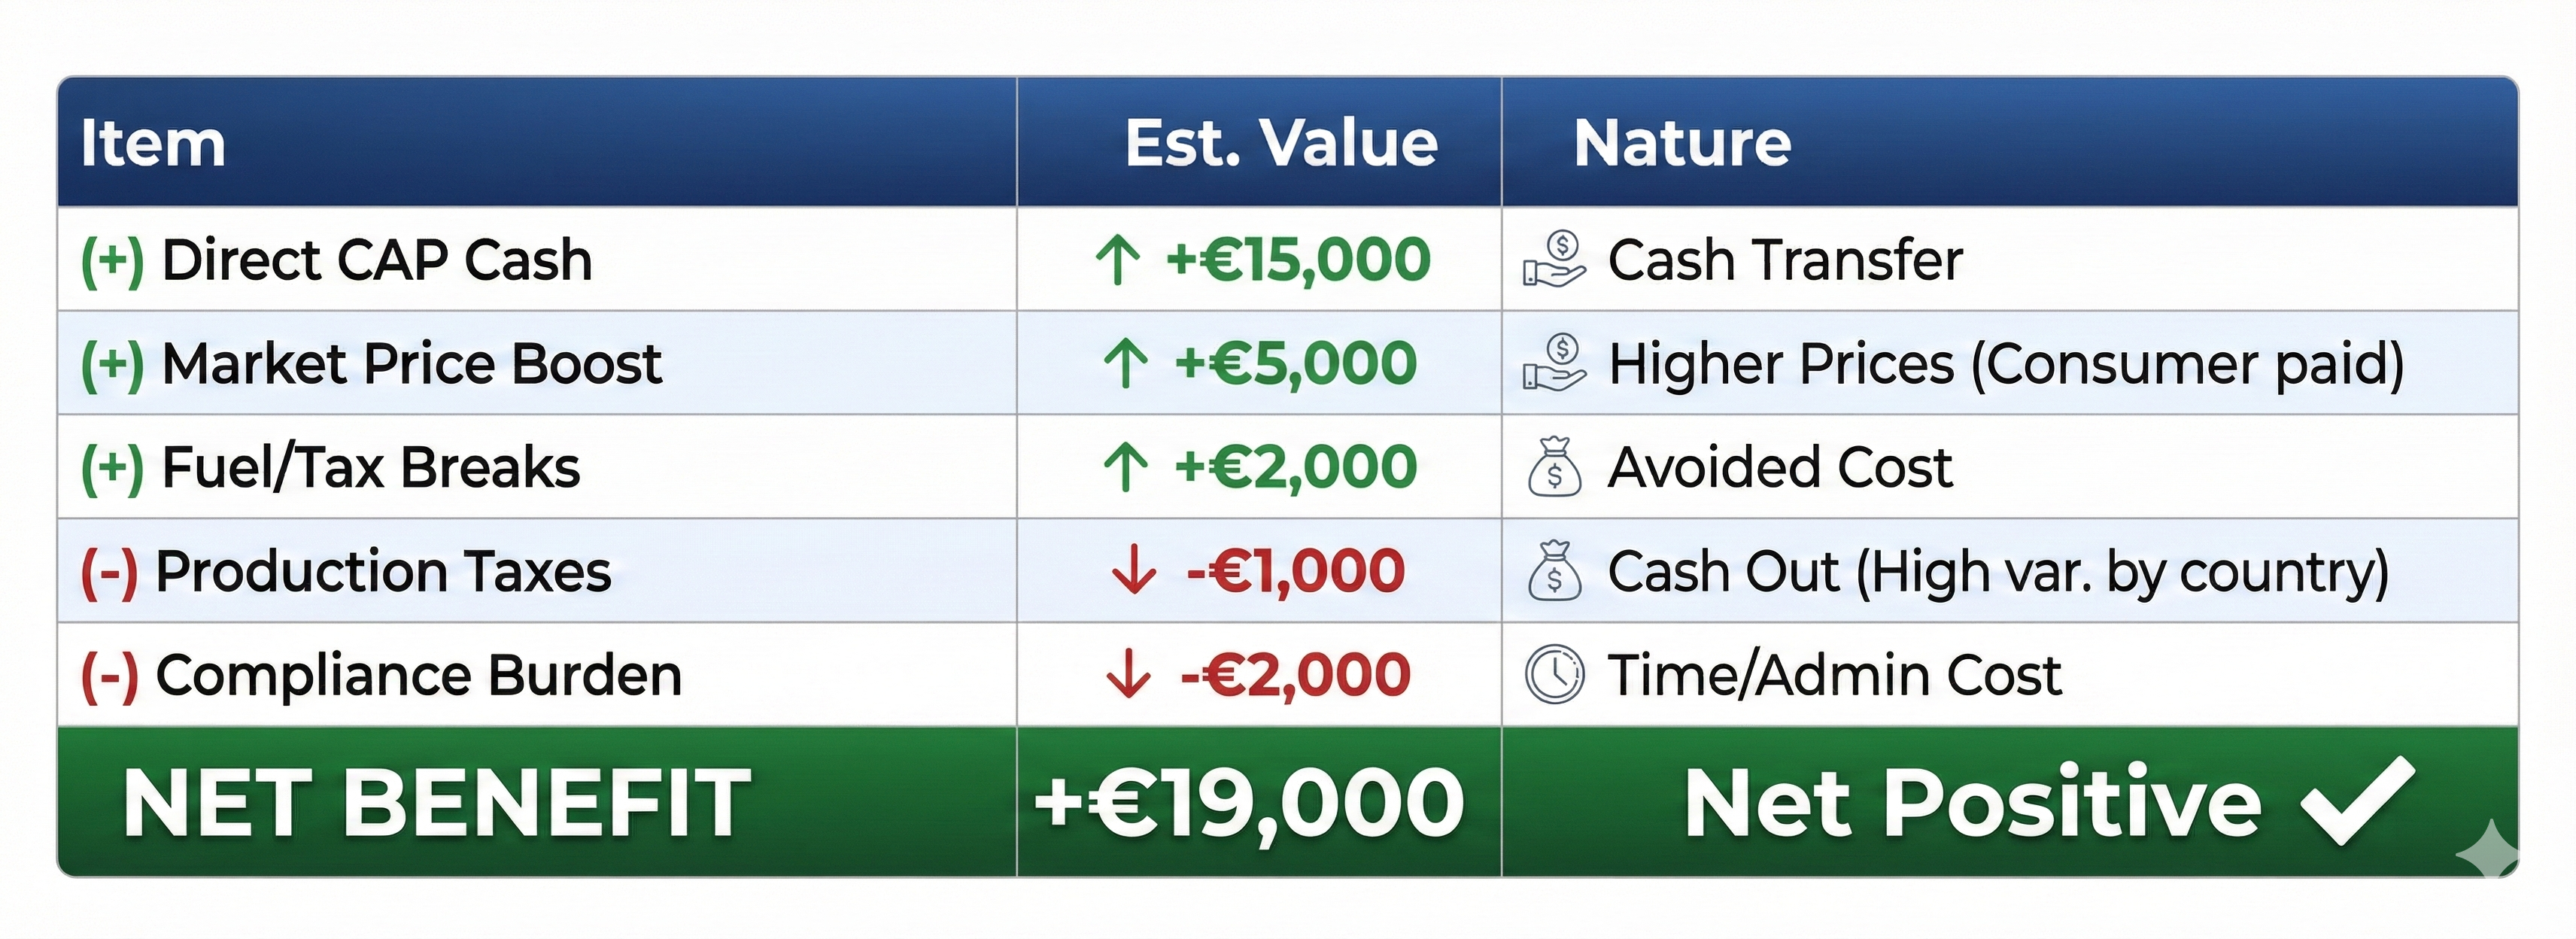
The Final Balance Sheet: A Hypothetical Audit
For an "Average" EU Farm with €100k in gross receipts, the flows look like this:
Strategic Implications
1. The "Donor to Client" Shift: Governments are transitioning from being a "donor" (paying farmers to exist) to a "client" (hiring farmers to sequester carbon). This changes the psychological contract: the cheque no longer feels like a benefit, but rather payment for services rendered, squeezing the perceived margin.
2. The Inflation Trap: While the "Net" remains positive, it is shrinking in real terms. Subsidies are generally fixed (flat budgets), but input costs (fertiliser, labour, machinery) have skyrocketed. A €300/hectare payment buys significantly less nitrogen today than it did in 2019, eroding the real-world value of the support.
Suggested Actions
For Investors: Focus on regions with "high net" retention (Poland, Romania) where the gap between subsidy and tax is widest.
For Policymakers: Recognise that "Green Inflation" (Eco-schemes) acts as a de facto reduction in support; simplifying compliance is the cheapest way to improve the farmer's net margin without increasing the budget.
Sources
Analysis: Based on aggregated EU agricultural balance sheet data.
Tax Data: Institut Économique Molinari (French production tax analysis).
Support Estimates: OECD Producer Support Estimate (PSE) data.